If you have read my book the Lean Game Plan, you know I talk about Value Stream Mapping as the first step to understand where you should focus your improvement efforts. If you have never completed a Value Stream Map for your organization, it will be helpful to develop l an Enterprise Value Stream Map (EVSM).
An EVSM shows how the entire organization adds value to the customer. An EVSM shows what happens from the time the phone rings until you deliver a product or service to your customer. After you have developed an EVSM you might develop a Value Stream Map (VSM) for a specific product family or process within your organization that you believe contains waste.
Value Stream Maps should help you “see” where the waste is within your organization so you can go about eliminating the waste. Value Stream Mapping allows you to see the flow of processes and the flow of information. Because they are icon-based, they can be used within any industry. If you know how to read the icons you can understand how an organization adds value to the customer. A common practice is to develop value Stream Maps for your current state of operations first. Here is an example of the Current State Value Stream Map icons.
![]()
The commonly used icons are the process/data boxes, outside source icon, the operator box, the inventory triangle, and the movement arrows. If information is shared electronically the lightning bolt is used to show that information sharing. The truck, fork truck, or rail icon shows delivery or movement of material. We identify inspection by using the look icon.
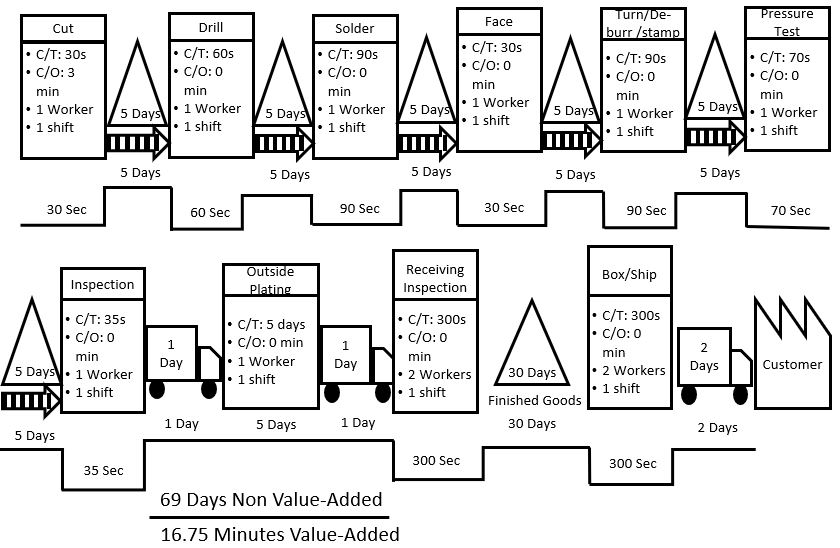
The most important element to include in a Value Stream Map is a timeline across the bottom that shows the ratio of value-added to non-value-added work. I have seen current state Value Stream Maps with Value Added ratios as low as 2-5%. Low ratios are common because companies have a lot of inventory or huge queues between operations. Sometimes orders get stuck in the office processes for lengthy periods, which causes delays.
When beginning your Value Stream Map, first understand the order of the processes and focus on getting them in the correct order. It is easiest to use long pieces of butcher paper spread out on a conference room table. Then you can develop the steps of the process using icons written on sticky notes. Because they are on sticky notes, if you need to move them around it is easy to do.
Once you get your processes in the correct order, then you can fill in your process boxes with the information about that process. Information to collect includes Cycle time (think of this as touch time), set-up times if they exist, yield if a problem, number of operators, and number of shifts the process operates. If it is an office process, you can also include % C&A which is % Complete and Accurate.
After you have your processes in the correct order with inventory and delays identified, it is time to take your Value Stream (or a picture of it) to the area that you are mapping and walk it backward through the processes. Why do you think it is important to walk it backward?
This helps you identify any mistakes that you might have made when developing your map. It is not uncommon to skip steps! Walking your map backward helps you capture the steps that you might have missed.
Another reason to walk your map backward is to use this time to conduct a waste walk. Take notepads with you as you journey backward and interview people in the processes- especially office processes.
Ask them what they struggle with. Ask them how long it takes to do their work. Look for piles of inventory and count parts. Look for piles of files. Ask how long work sits between operations so you can capture the time as a delay. Use the eight wastes as a guide for identifying waste in the processes.
After you have conducted your waste walk, double-check your process order, and make sure they are in the correct order. Capture any electronic communication between operations. Understand the scheduling process. Add in your inventory and delay triangles. Complete your process box information.
Complete your timeline of value-added to non-value-added work across the bottom. Don’t be surprised if your current state map shows you have less than 50% value-added work!
Next time we will discuss developing your Future State Value Stream Map.
As always, it is an honor to serve you and I hope that you and your company are getting better every day!
Follow me on Twitter
Join me on LinkedIn
Listen to the podcast here